For
Overview
Tableau is a software for building, publishing and sharing interactive data visualizations. There are currently two different versions available:
Tableau Desktop/Online: licensed software granting access to all Tableau features
Tableau Public: free version of Tableau with reduced features, requires public online sharing of each visualization
Process
Download the application
Both the free and public versions can be downloaded directly on the Tableau website.
The full desktop version is available here with a 14-day trial version.
The free public version is available for download here.
Connect your data
Tableau allows a live connection or extraction of data in many different sources and formats including Excel, text, JSON, Google Sheets and Access.
Spatial data can be added in multiple formats including shapefiles, GeoJSON, KML and GPKG.
Tableau requires creating a relationship between each data source. Hence, if using more than one dataset, there should be at least one common attribute between a minimum of two datasets.
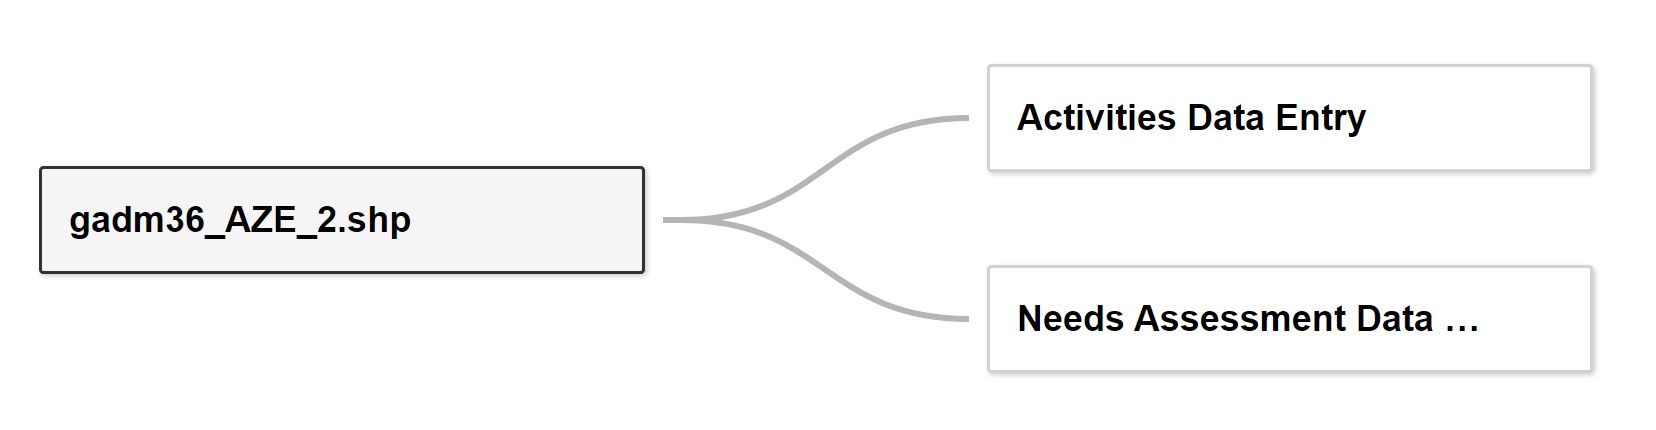
Below is an example of a relationship between three datasets: Two Excel files, “Activities Data Entry” and “Needs Assessment Data” connected to the shapefile “gadm36_AZE_2.shp”. The Admininistrative Administrative Level 2 PCode is a used as a common attribute across all three dataset.
As a limitation, Tableau does not provide a built-in ETL (extract, transform, load) tool for data manipulation. Accordingly, your the datasets should be as ready for use as possible. If this is not the case, and you prefer not touching the data in the original source(s), an interim dataset, script or ETL system (such as FME) should be used.
Build your dashboard
After completion of the data connections, you will be able to start building the data visualization.
Tableau visualization interface consists of three different elements:
Sheets for building individual visualizations
Dashboards for compiling the different visualizations.
Stories for bringing together the different dashboards.
The first step is thus to build the individual visualizations required for the dashboard.
Tableau offers a broad range of built-in visualization options including charts, tables, indicators and maps. The map elements allows using basemaps base maps from Mapbox and WMS services.
Based on the data type, Tableau will automatically propose the recommended visualizations in the “Show Me” tab. However, the “Marks” panel allows endless customization options for each visualization, whether in a table, chart or map format.
The dashboard elements allows setting up the page layout (size, orientation, background colour) and bringing together the visualization on each Worksheet.
On Tableau, the visualizations are not connected by default. All interactions, including filters and slicers, must be thus set up with the “Actions” tool.
For single-page dashboards, the work is completed once each visualization has been neatly added to the “Dashboard element”. In contrast, the “Story” element should be used for creating for dashboards with more than one tabs.
Publish and share
If using Tableau Public, each version of the dashboard will be automatically available for view on the Tableau Public server. You can share your work simply with the URL address of your dashboard. Alternatively, any user can download your workbook and use it on their own Tableau desktop application.
The full desktop version of Tableau comes with further sharing options, including restricted sharing by email and different cloud channels. If publishing your work online, you can also make your dashboard password protected, thus restricting the access from non-authorized users.
Additionally, the full version of Tableau allows exporting the dashboard, in full or in part into a PDF format. This feature is particularly useful when the visualization is used in low-bandwidth environment.
Tips
Use the PCodes and ISO codes to connect different datasets. Tableau requires connecting each dataset in that you are using in your visualizations. Wherever possible, the most convenient way to connect two or more different datasets is using the PCodes. When using other attributes such as names of a country, district or settlement, there is a risk that the spelling is not exactly the same across the datasets, thus creating a risk of missed links.
Use the “Aliases” tool to change the field and attribute names. Ever come across with names such as HHs_Female_U18_1-3_PWD_Yes or potableWaterPerHhWithIdpStatusBaselineApril2020? While technically necessary when using KoBo or other MDC tool, such names tend to be inconvenient or even unreadable to the end users. Generally speaking, the end users prefer to see standard spacing instead of camel cases or underscores used by KoBo or other similar tools. Hence, where necessary, you can use the Power Query to create duplicate columns with aliases and thus, increase the overall user experience.
Leave an “expansion space” for your visualizations. Especially in large-scale sudden onset disaster situations, the figures tend to grow in a rapid pace. In addition to the absolute figures, the number of categories is likely to increase: more districts, more distinct groups of people affected, more response organizations coming into play… The increasing number of figures and categories normally means further population of the visualization elements, whether in a map, chart or table formats. Accordingly, in the very early phases of a disaster, do not squeeze your visuals into a too small space but make sure that the visuals will remain readable and meaningful even with the rapid changes of the situation. The same applies to the map elements: check that the zoom level of the map will expand as new geographical areas are being covered.
Do not use Tableau Public with sensitive or confidential data. One of the disadvantages of Tableau Public is the compulsory sharing of the dashboard to the wider public. Even if you are not advertising the dashboard outside of OCHA, there is still a significant risk that outside audiences will accidentally find the dashboard. Accordingly, Tableau Public should not be used to display data containing any confidential, personal or otherwise sensitive information.
Outputs/Resources
Download the full Tableau Software (includes a 14-day free trial)
Tableau Resources: How-to Videos
OCHA Tableau Template 2019 (A4 landscape & portrait)