Explain what this how-to article is for. For example, you might write an article to teach people at your company how to set up a corporate email account or file an expense report.


- get unique users(“All Events - Unique”)/unique downloads(“resource download - Unique”) from https://mixpanel.com/report/975561/insights#report/6997615/pv-dl-all-excluding-bots-hxlproxy-hdxinternal (set timeframe + show data as “table”)
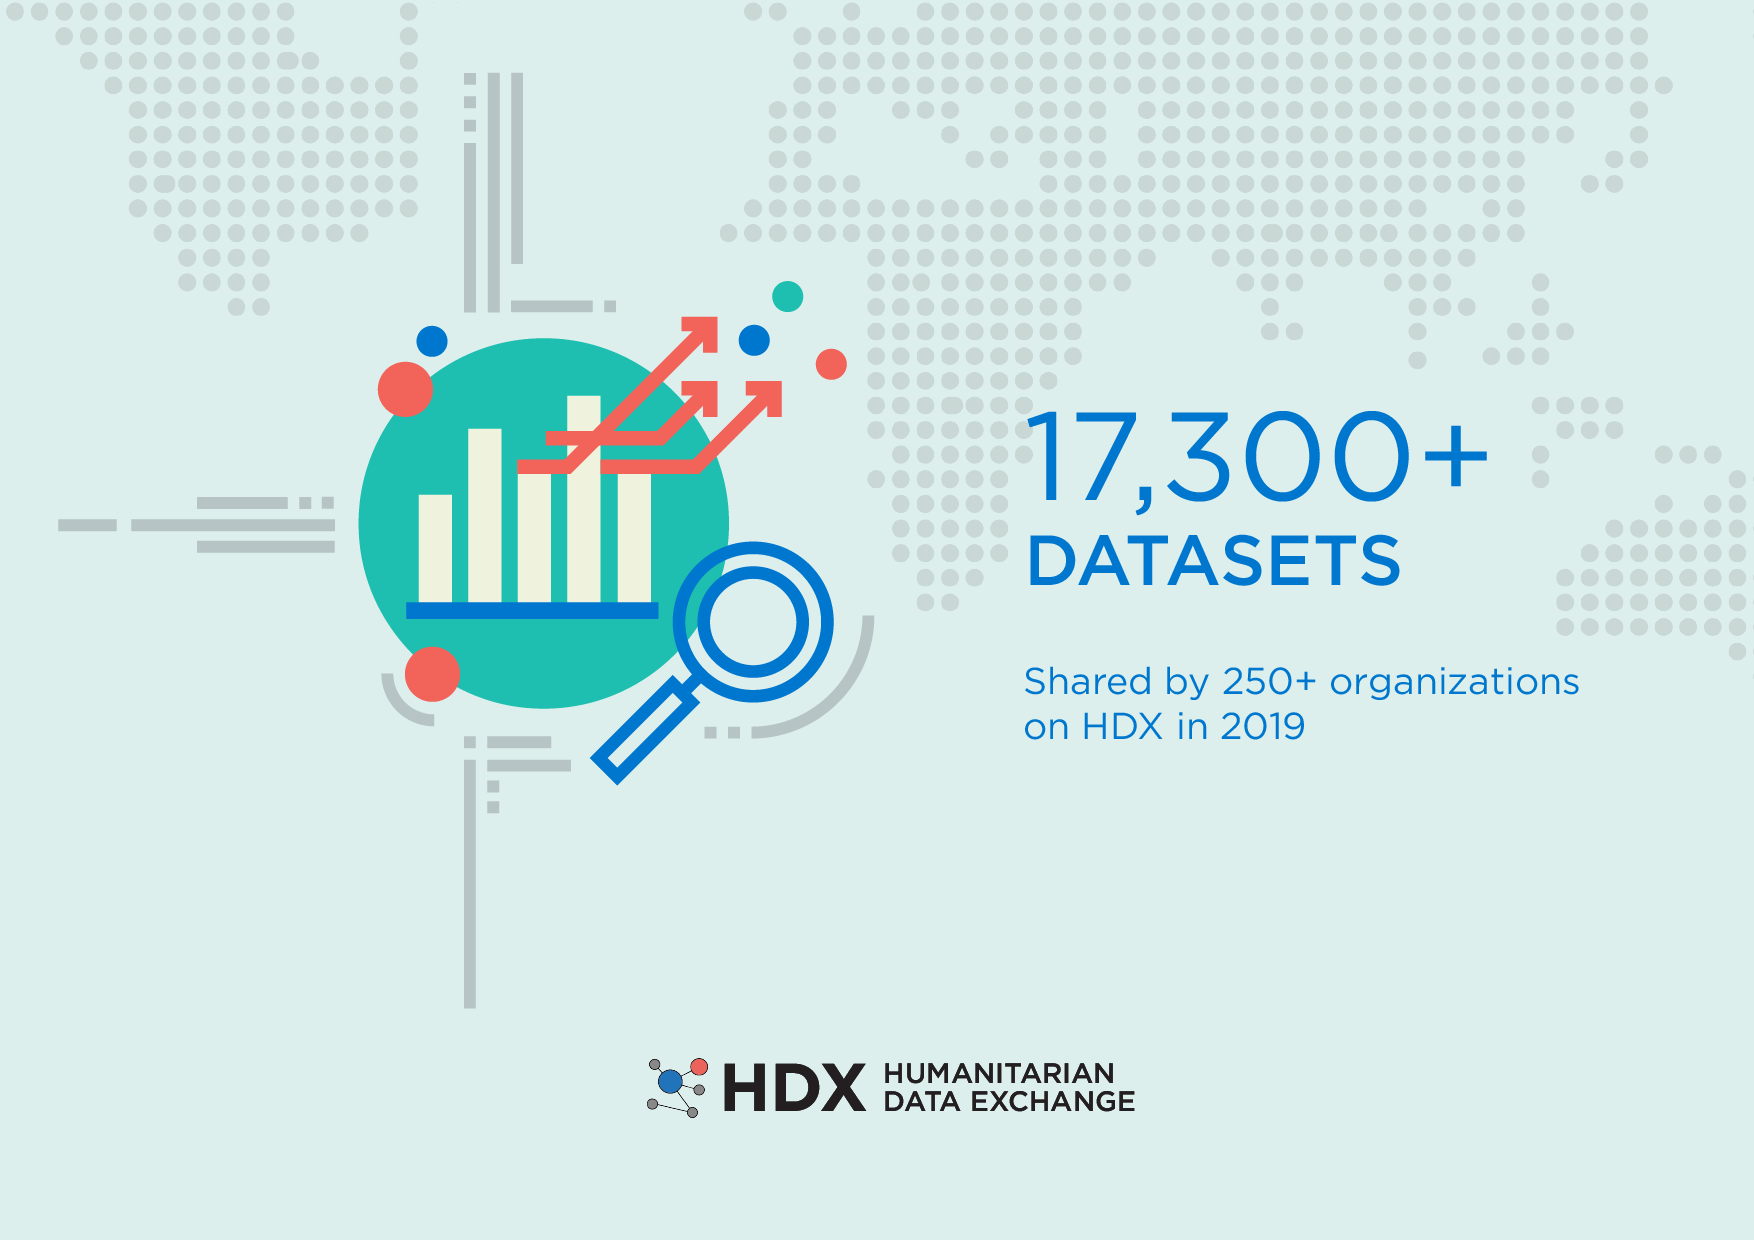
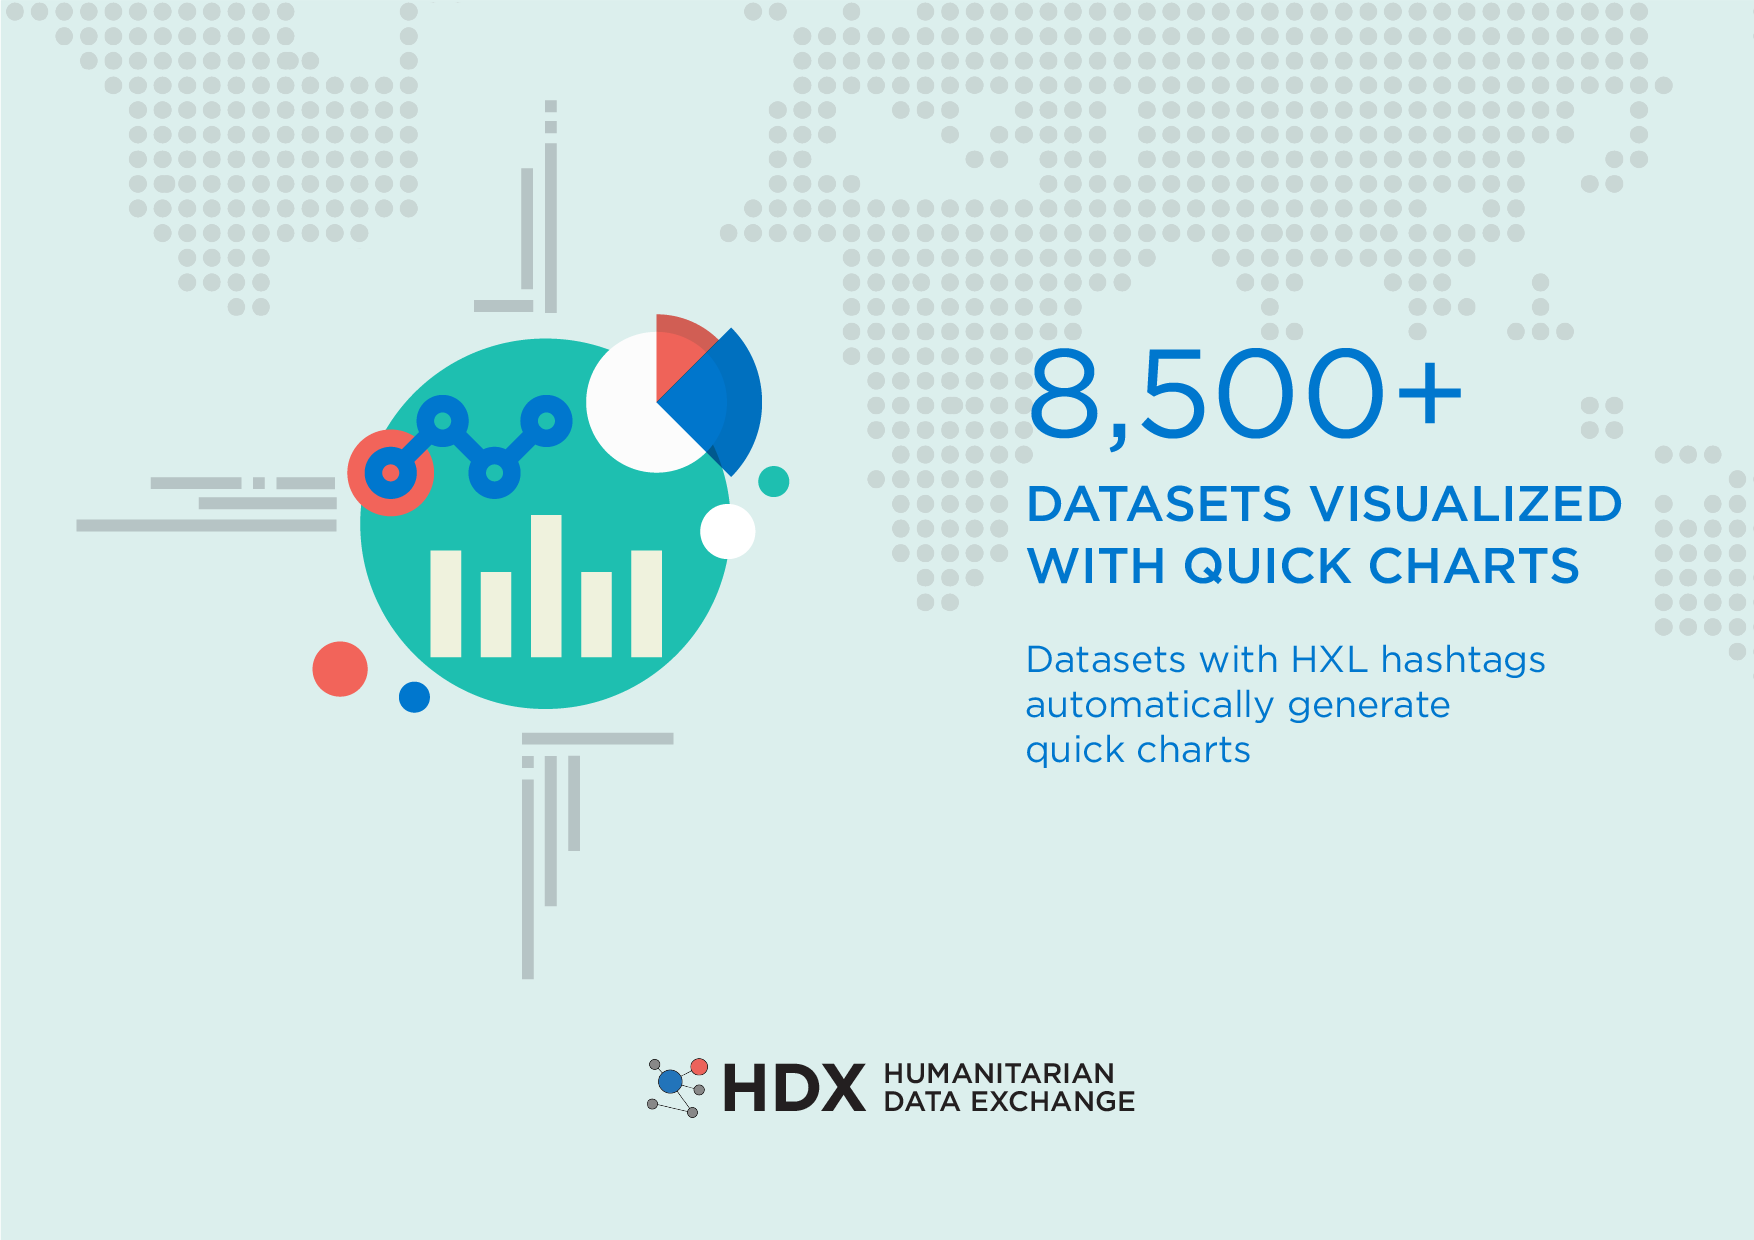
- get hxlated datasets/dataset with quick charts/# of datasets(make sure to update # of orgs) from HDX
- get % of completed data grid from DPT/DS team
source file(.ai): https://drive.google.com/open?id=1nGQNHAIy-sdBDgXFcXD2nqgSK8yhBtoD&authuser=yumi.endo@humdata.org&usp=drive_fs
2019 data included data from Jan 1 2019-Dec 16 2019 |
see How to Create the Year-in-Review emails
2019 stats - sent to all orgs admins(no minimum downloads)
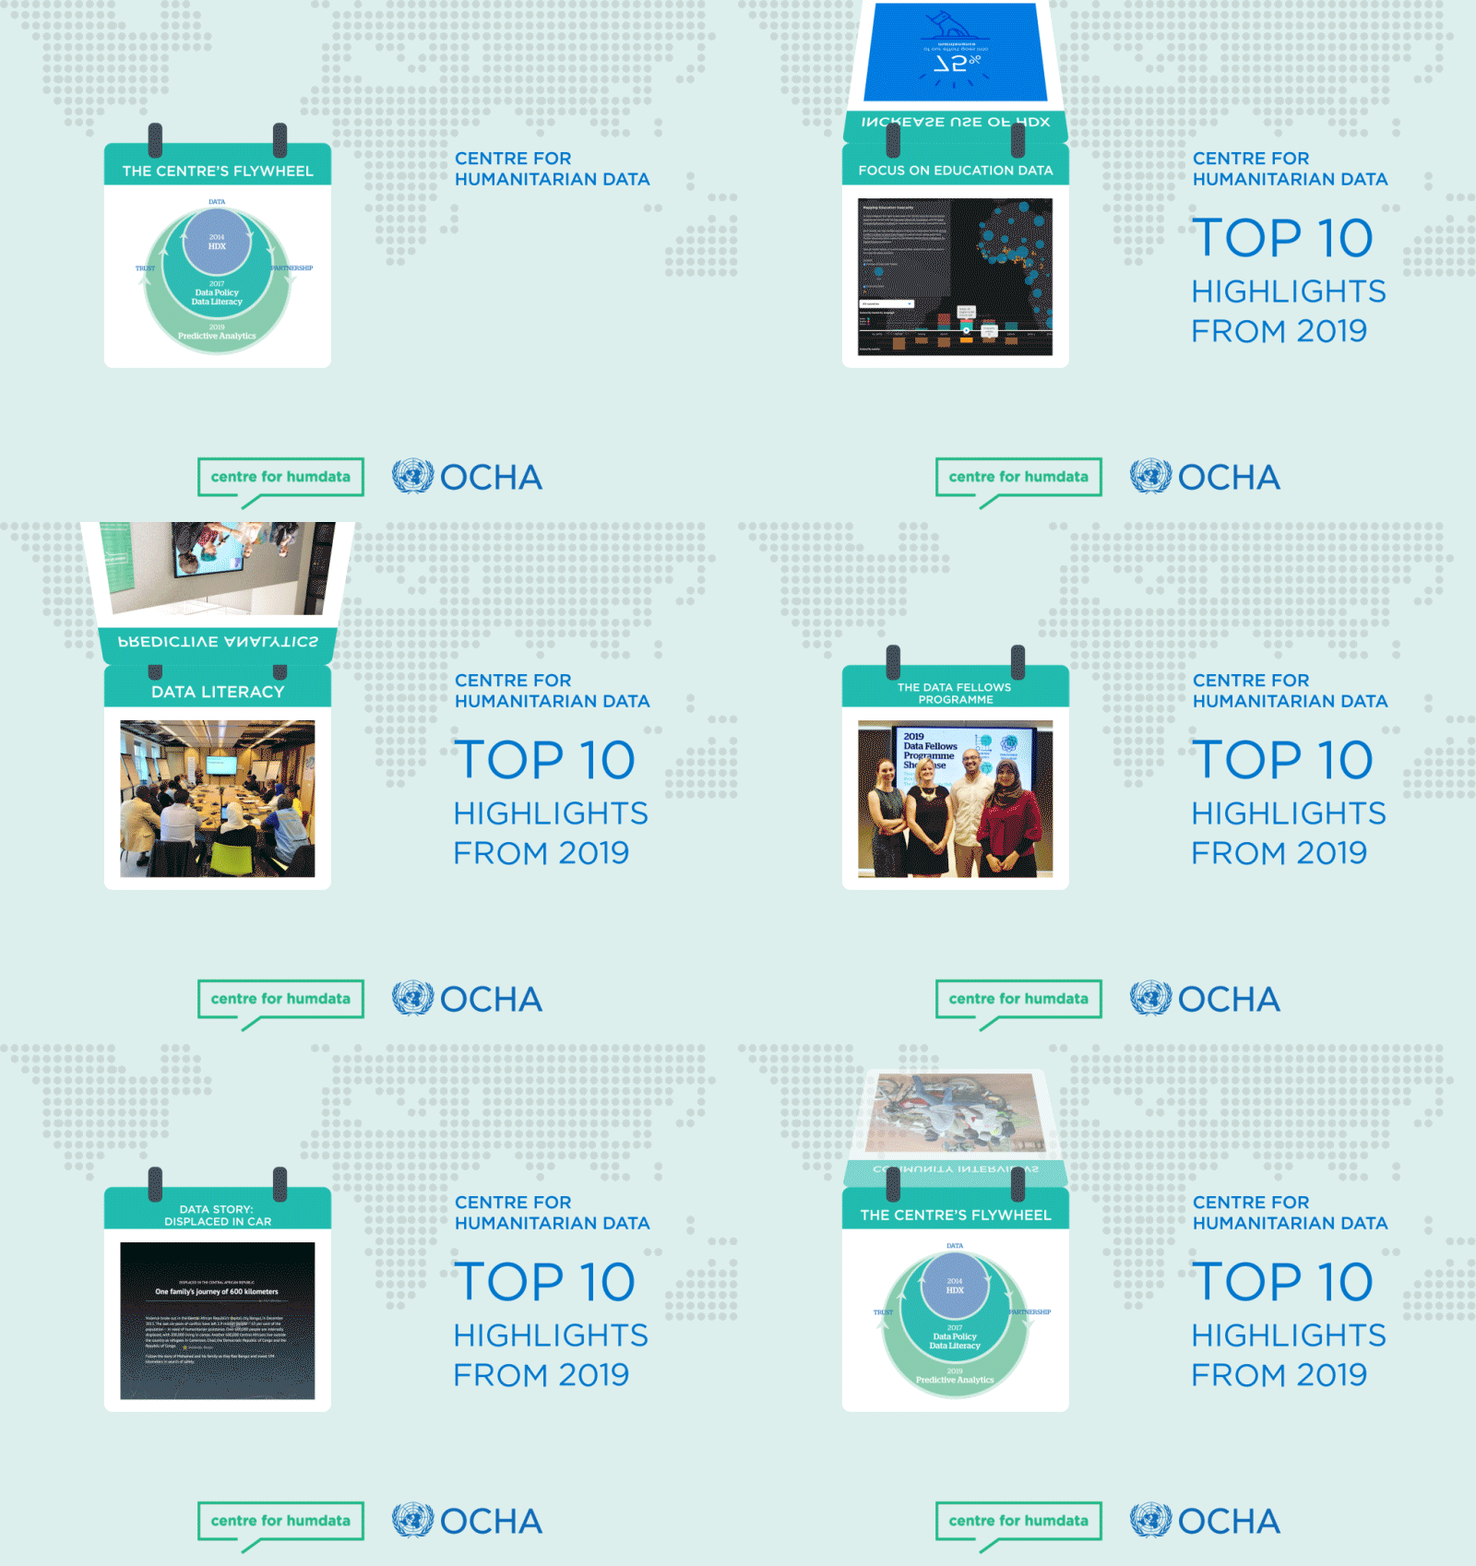
Reliefweb banner(300 × 450px): source files: https://drive.google.com/drive/u/1/folders/1YifeZ1EoC-VcPAL5A7kvjTX5VwdRmDcZ

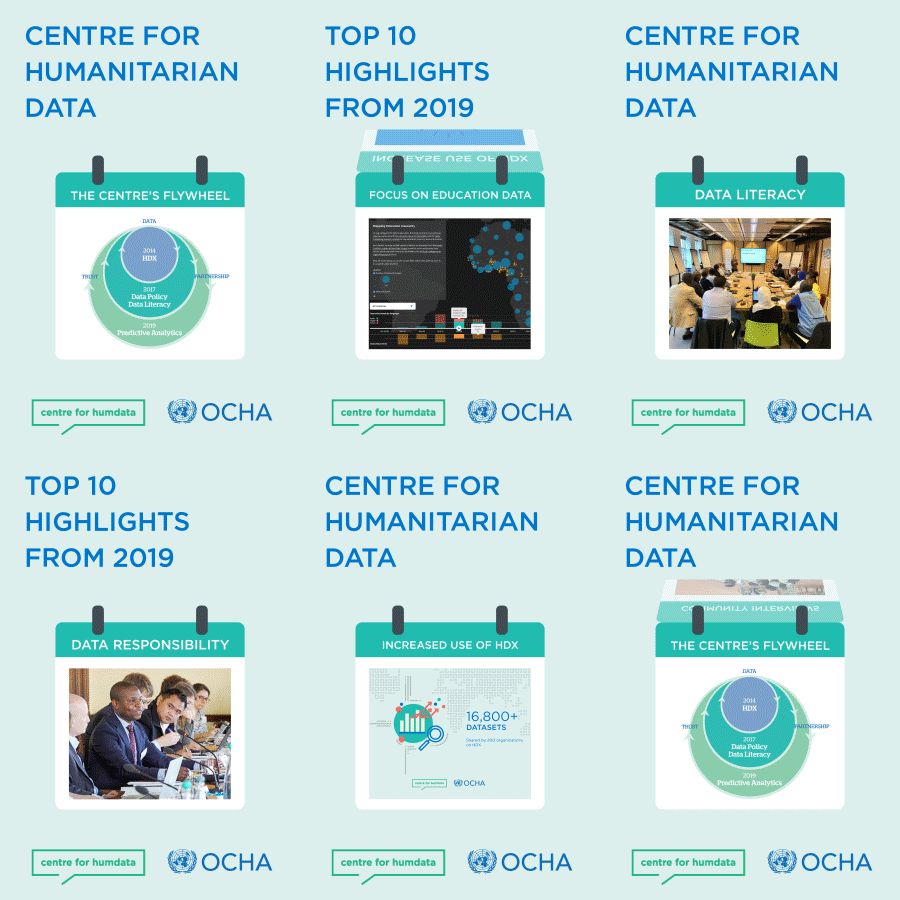
twitter banner: 800x566px

The content by label feature displays related articles automatically, based on labels you choose. To edit options for this feature, select the placeholder below and tap the pencil icon.
|