Overview
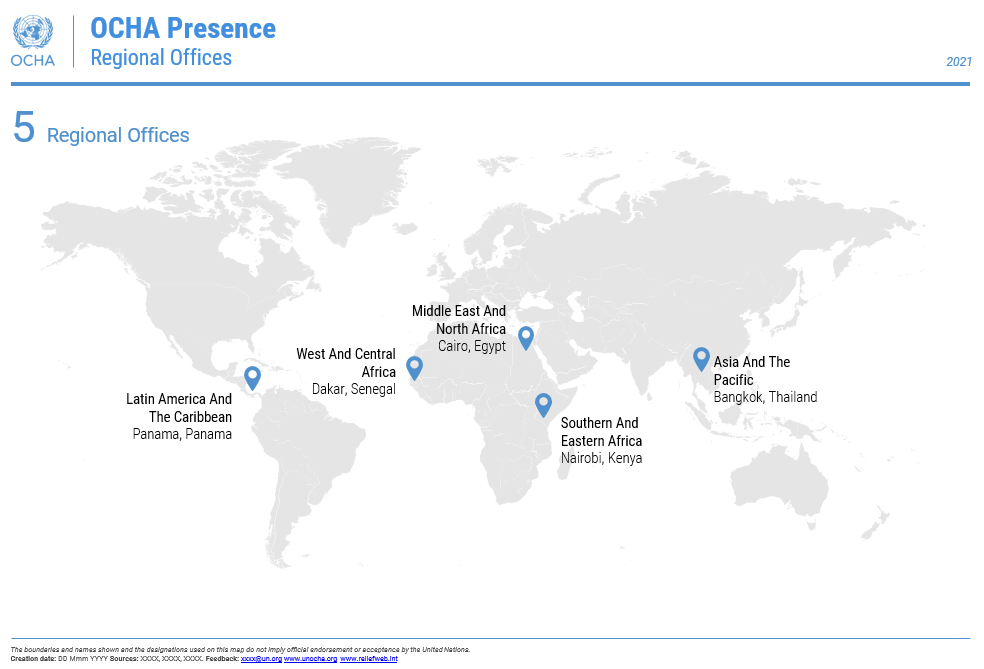
This is a sample map developed using MS PowerPoint.
This page covers how to create simple maps using Microsoft PowerPoint and which standard templates to use for PowerPoint maps.
Process
Using MS PowerPoint, users can create simple boundary maps to be inserted in reports or printed to facilitate meetings. For field offices where there are no IMOs or in time of emergency where IMOs are busy with time-consuming tasks, HAOs can create or edit existing PowerPoint maps for their use such as highlight highlighting affected areas, indicate indicating areas included in field assessmentassessments, or show direction of population movement movements, etc.
Steps to create a map in PowerPoint:
users need GIS software and MS PowerPoint
With ArcGIS software:
Add the administrative boundary and other shapefile shapefiles (towns, water bodies, etc.,) that users want to be part of the map in the GIS softwareassign desired.
Assign the proper symbology and label for each shapefile
once When satisfied with the extent of the map and layer arrangement, export the map from GIS as Enhanced Metafile pictures (.EMF)open
Or, using EMF files provided with Administrative Boundary CODs:
download the appropriate EMF files:
Then:
Open the PowerPoint template (available in the ‘guidance’ section at right) and insert the exported EMF file right as a ‘picture’.
Right-click on the inserted picture and click on the Group > Ungroup option, this . This will make each point, line, polygon and label feature of the map editableyou . (You will get a warning that you want to convert the picture to Microsoft Office drawing objects, ; click yes.)
Steps to edit a map in PowerPoint:
display Display the Selection Pane from the Home tab of MS Power Point, this makes the list of drawing objects visible.
Right-click on the feature (point, line or polygon) you want to edit.
users can change Change the color, thickness, etc. of the selected feature from the Format tab using Shape Fill/Outline and OCHA color palette from the template.
users can copy Copy-paste humanitarian icons, inset globes, insert arrows, etc. to show movement direction, insert text box or callouts to add short explanatory text, etc.
Save.
Outputs/Resources
PowerPoint Map - OCHA Philippines example of mapping in power pointPowerPoint Map - Nepal (Map Action) example of mapping in power point
Check the Administrative Boundary CODs (COD-AB) datasets on HDX for EMF format files to create power point maps
Guidance
Infographic PowerPoint template